Be yourself; Everyone else is already taken.
— Oscar Wilde.
This is the first post on my new blog. I’m just getting this new blog going, so stay tuned for more. Subscribe below to get notified when I post new updates.
Be yourself; Everyone else is already taken.
— Oscar Wilde.
This is the first post on my new blog. I’m just getting this new blog going, so stay tuned for more. Subscribe below to get notified when I post new updates.
For the better business Bureau one thing that I liked from there report was that they had a plan for how much they were going to spend for a span of 4 weeks. The group also put together a chart that showed how many conversions they got relative to how much they spent.
Attribution models
Single touch
pro gives focus one action
con ignores other actions that lead to a sale
First
Pro looks at what got people to your sight con first click does not lead to a sale
Lead conversion
Pro looks at what got the lead con does not look at what led to the lead
Last click
Looks at what lead to the sale con ignores the rest of the process
Multi touch model
Pro looks at whole process con is a more complex model
Linear
Pro gives equal weight con that it is to simple
Descending
Pro gives more credit for the closing con gives less focus to the first parts
U shaped
Pro credit is given to first actions con the rest is ignored
W shaped
Pro most accurate model con there are not any
Full path
Pro treats all parts equally con it does not have a focus
Custom
Pro you can make what you need con there are no standards since it is rarely used.
The part that I will use for my client is the w shaped because it gives credit to what is important while looking at the hole picture.
The google conversion report shows the path taken to see how effective your marketing plan is. This is a great tool because it allows you to be able to assess whether your efforts are effective or if you need to spend your time somewhere else.
After reviewing the pre and post campaign report the two different strategies i can take away from them are to pick a precise location you have multiple ads in order to compare to see which ones do better than others. These takeaways are important because the first one allows for us not to waste resources on advertising to areas that will likely not respond. The second takeaway is important because it allows for us to see what works and how to change the campaign order.
At first I thought that the path that leads to a conversion isn’t important but now that this path is crucial because marketers want to know what you are clicking on there website and how you access there information.
At first, I thought that you cannot track calls conversions on the google ads but now I know that this is possible, and this is something that our client is inserted in.
Based on what I learned my conversion strategy will be based on how we can direct people to call in to the restaurant along with if they go to the website. We will do this by creating a ad the user clicks on it. They then can see the menu and can then decide weather to call the restaurant or if they want to go to the website.
1.1
There are many skills that are important to be able to analyze data one of the biggest things is clarity for instance if we were to say that there were 10 COVED deaths what does that mean exactly does this mean that they died because of coved or does that mean that they died and they had coved. This is quite important because this will add to the death count unnecessary making the problem worse than it is. other aspects that are important is understanding the context of the data so that someone can replicate your results to ensure that the information is correct. Critical thinking is important so that someone can determine if the info is accurate or if it should be thrown out. Open mindedness is also important to see the problem from all different aspects.
2
For the kern county COVID dashboard I do not know whether I like the green background. one thing that I like about it is the chart is that it shows a variety of information based on what you want to see. One thing that I do not like about it is that the colors clash with each other. The global COVID tracker is quite simple it shows you new cases and new deaths and that is it. It also gives you a map that shows the number of deaths per country. Things that I do not like about this set up is that it does not give you a lot of information and the map and can be misleading. My favorite one is the kern county map because it gives you all the information so you can make your own decisions.
3.
The more information that is presented the better conclusion we can make. different governments and organizations need to use all different types of Covid dashboards to determine what would be the best plan of action. It is crucial for government organizations to be able to determine what needs to get done as different situations pop up. Hopefully, we will have a vaccine that will come out this year. this will mean that we will have one of the biggest logistical nightmares that mankind has ever seen. depending on how we decide to distribute the vaccine is important to know where the hardest hit areas and who are those who are most susceptible to the disease. these are the first vaccines that should be distributed when they come out to the public. Businesses also need this information because they need to be able to predict what the situation will look like in their area so that will be better prepared to do business. If we can predict if Covid will hit an area particularly hard than other businesses may want to stock up on necessities items that people need and quickly sell off those items that will be unused. Information like this is crucial to our client because he needs to be able to predict the local government will do to better prepare for the situation. If there is a trend where Covid cases are spiking up that it is likely they will shut down in person dining therefore, it is crucial to come up with a plan to sell pizza online.
Video.
In how to excel in tableau they talk about switching from excel to tableau. Tableau is different from excel because excel is used for spreadsheets while tableau is used for processing analytical data. In this presentation we learn how to use tableau by looking at data about bigfoot. I learned that excel and tableau are two different programs, but they can be used together to find out even more information.
1. At first, I thought that all restaurants spent time and money researching different locations to figure out the best location to place their restaurant. But now I know that they place their restaurants near their competitors. I think this is both a good and bad idea because they get the benefit of not having to pay for the research but the downside it that there is a greater risk of having a mismatch resulting in having no customers.
“following the leader. This occurs when a retailer, say Burger King, simply locates near its competitors”. (Location Intelligence, Research and Applications)
2. At first, I thought that fast food restaurants get most of there customers from drive through but then I learned that some restaurants are get more walk-ins over drive thru. This is because these restaurants are within a convent location and why hassle with moving your car if you do not have to. I also think that it is interesting to see restaurants like McDonald’s that people drive buy and pull over to get food.
“For instance, McDonald’s may capture a sizeable portion of its sales from commuters or travelers, while Burger King may be popular with pedestrians in cities” (Location Intelligence, Research and Applications)
3. my question has to do with the article in whole, what would the results look like in other cities across the us big and small and what if there were more factors like adding more restaurants like taco bell and jack in the box.
General overview
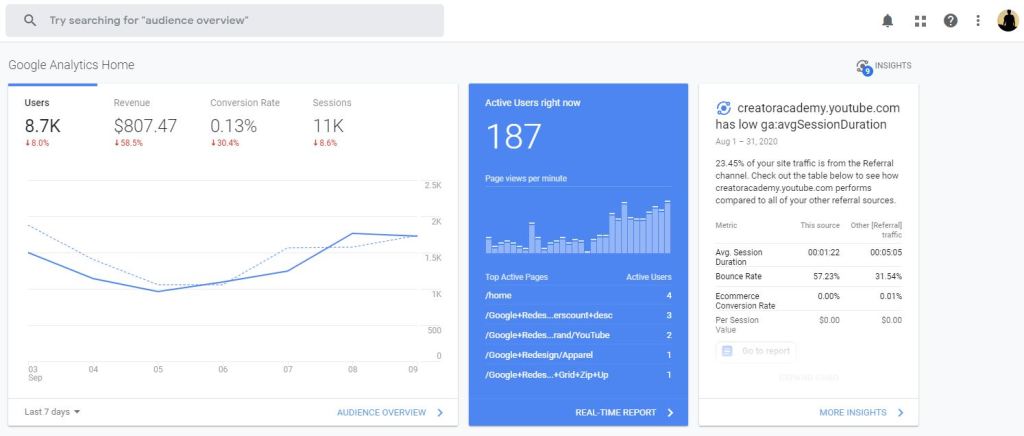
The general overview shows the number of users that were on the website during a seven-day period From September 3 to September 9. The trend that is shown is that the number of users went down from the third to the fifth but then went up from the fifth to the ninth.
Audience overview
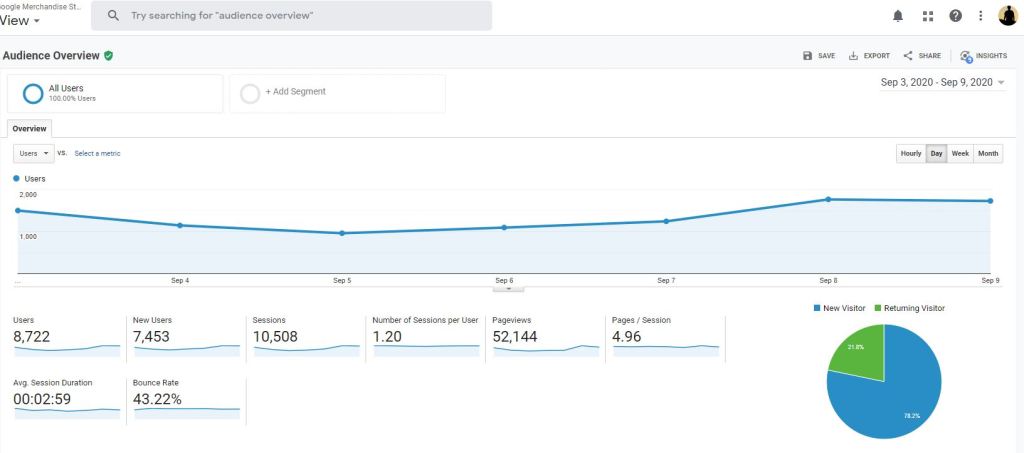
the audience overviews choose a total of 8722 users with 7453 of them being new users. Number of users dip down from the third of the fifth and returned to having more users than when they started. This shows the Google website can easily get new users while having a healthy number of users return.
Acquisition overview

the acquisition overview shows how the number of users were converted into purchasing something. What is interesting to see is that as several users went down to the number of conversions did something completely different. The number of conversions from the third to the ninth started high and then went down as the week went on.
Behavior flow
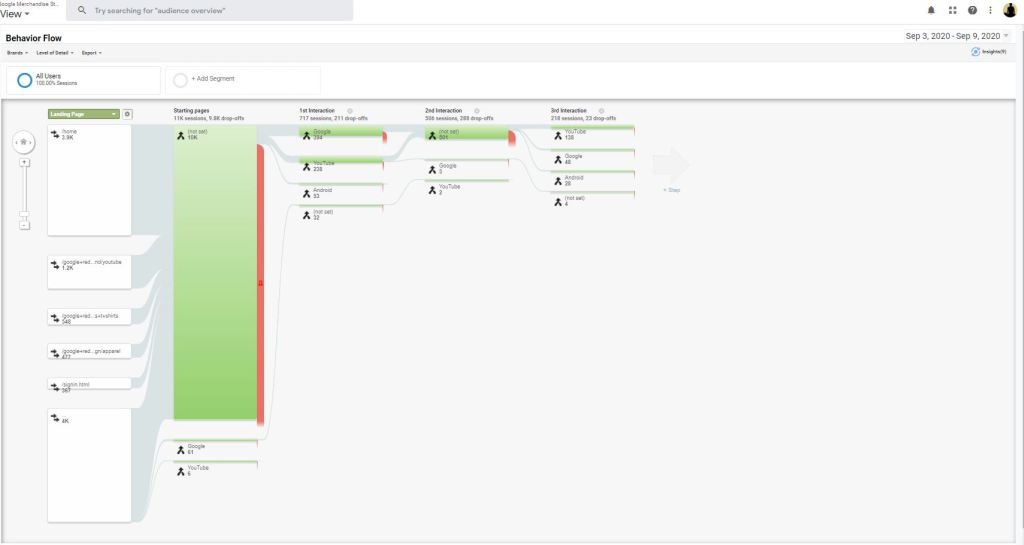
behavior flow chart depicts how users into the website and where they go from there. It is apparent that most people who clicked on this page was brought to it by several different sources. When it came to the first interaction around 90 percent of the users jumped off the page. What was interesting to see is that after that the number of users that went from page to page were cut down by around half for each session.
Devises

devices show us what people are using to get on this page. What was interesting to see that by not looking at other that the iPhone users took up a portion of 35.2% the next category not looking at the one titled not set was the Apple iPad those around 2.5%. This page gives us some insight on what devices should tailoring the experience towards.

Here is what the ford meta tag said “Research Your Next Ford Car, Truck or SUV at Ford.com. Get Specs, Offers, Pics! Fun-to-Drive. Available EcoBoost®. MPG Savvy & Tech Smart. Most 5-Star Ratings. SYNC® Technology. Highest Owner Loyalty. Models: Escape, Edge, Explorer” -ford website
1.Brands could approach touchpoint management by creating the best experience possible weather is online or in person. To use a quote from the text book “customers buy stuff for what it means to them, not what it does”(Prevos, 2018).To do this business, need to ensure that they can analyze their touch points to ensure that there is not a discontent. Businesses should do a touch point assessment to figure out how they are doing in the eyes of the customer. Then they should look at this evaluation and figure out where to improve from. Tools and technology can be as complicated as you want them to be. You can conduct a simple study create a survey or you can analyze big data to predict what will be important to focus on.
2.The brands that I will list off are Tesla, Winco, and the Apple Store. The Apple Store would fit in category 2 shopping and delivery hybrid. We can go to the physical Apple Store or you can purchase an Apple product and have it directly shipped to your house. To get something from Winco you must go into the store and pick it up therefore making Winco a traditional retail. Tesla motors is a pre-pay e-commerce where you purchased the car solely off the Internet.
3.Winco foods delivery fulfillment strategy is a traditional retailer and to keep themselves still relevant their strategy is to bring low prices to its customers by offering bulk bins and having customers bag there on groceries; “prices are low, and you don’t have to jump through hoops to get them.”-Winco website. The Apple Store allows for a hybrid system for customers to test their products along with offering online shopping for customers who do not have time to shop in store. Tesla motors has you preorder your vehicle, so they know how many vehicles to produce and wind to produce them.
4.The technologies that Tesla motors is using is big data in artificial intelligence; “They gather data from the online forum of their customers, and they use this to improve their next production.”- techiexpert.com. Apple utilizes big data tools like artificial intelligence in their series product and the use workable technologies like in their apple watches. A traditional set up like Winco would use big data to maintain a proper inventory.
5.Aunt Jemima syrup decision to change their branding was a good decision because it allows for them to reach out to a wider market by having a brand name that is more inclusive to others. This decision also allows for the ceric syrup manufacturer to be able to get the name out there and to look good in front of their consumers. New York times said that “product imagery was not only old-fashioned, but it continued to push forward the stereotypical plantation “Mammy” figure, and Aunt Jemima herself continued to be an unwelcome link to Southern racism.” New York times.
hi
