General overview
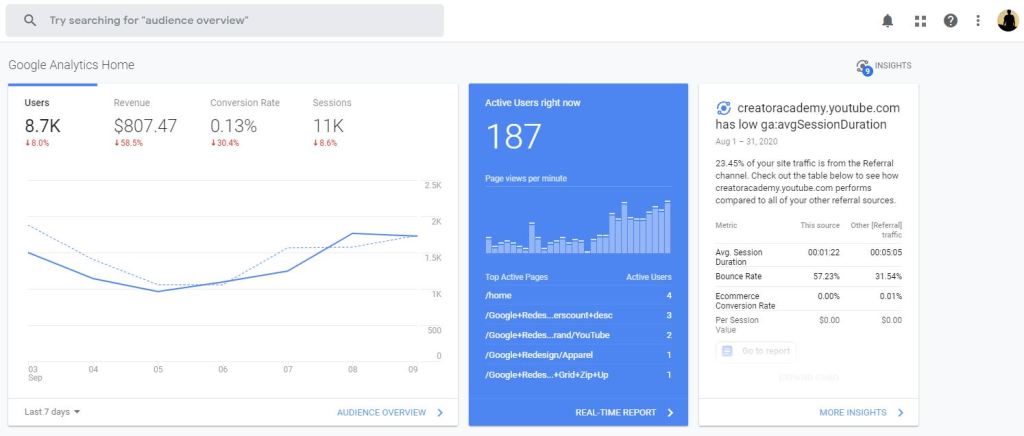
The general overview shows the number of users that were on the website during a seven-day period From September 3 to September 9. The trend that is shown is that the number of users went down from the third to the fifth but then went up from the fifth to the ninth.
Audience overview
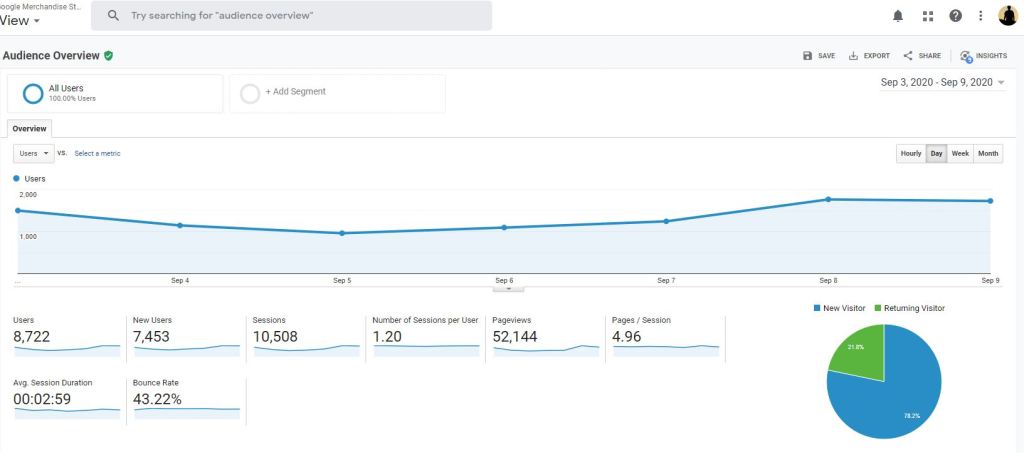
the audience overviews choose a total of 8722 users with 7453 of them being new users. Number of users dip down from the third of the fifth and returned to having more users than when they started. This shows the Google website can easily get new users while having a healthy number of users return.
Acquisition overview

the acquisition overview shows how the number of users were converted into purchasing something. What is interesting to see is that as several users went down to the number of conversions did something completely different. The number of conversions from the third to the ninth started high and then went down as the week went on.
Behavior flow
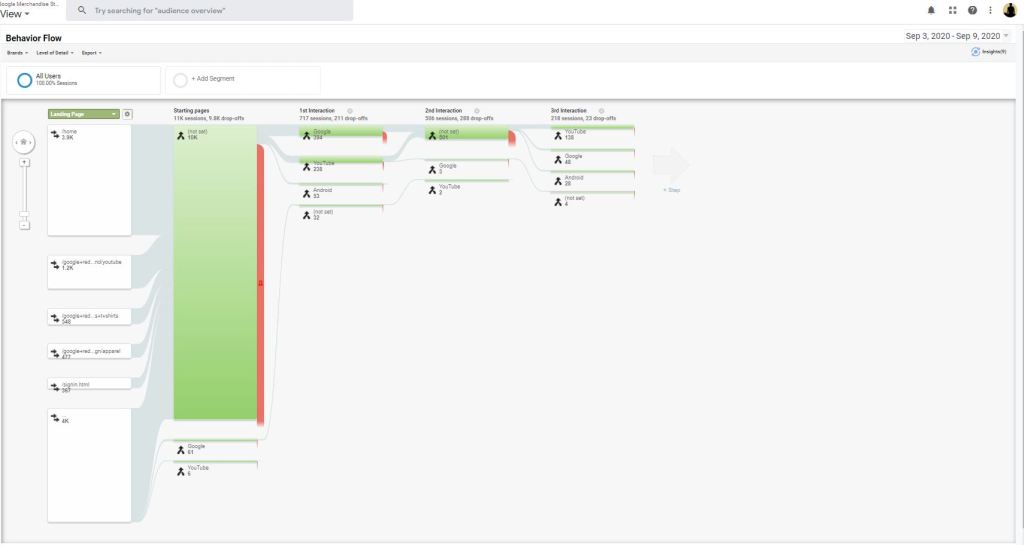
behavior flow chart depicts how users into the website and where they go from there. It is apparent that most people who clicked on this page was brought to it by several different sources. When it came to the first interaction around 90 percent of the users jumped off the page. What was interesting to see is that after that the number of users that went from page to page were cut down by around half for each session.
Devises

devices show us what people are using to get on this page. What was interesting to see that by not looking at other that the iPhone users took up a portion of 35.2% the next category not looking at the one titled not set was the Apple iPad those around 2.5%. This page gives us some insight on what devices should tailoring the experience towards.


